Jaroslaw Jozwiak
passive speaker crossover design
every loudspeaker can be improved
do it yourself or with my help
jjcrossovers.com
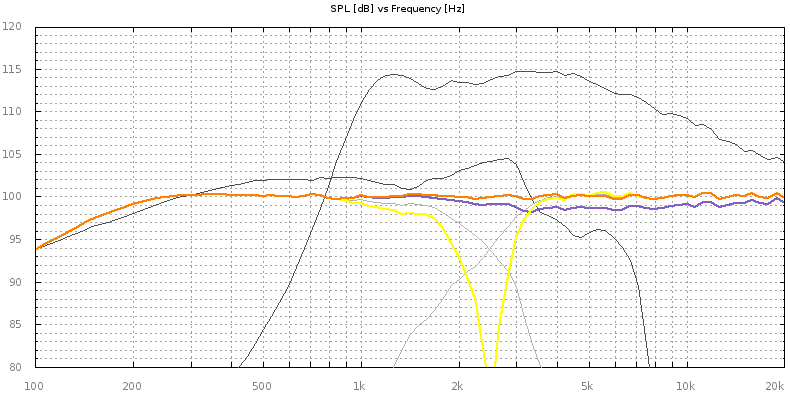
As first you can see simulated SPL answer example. The orange plot is current simulated answer. The violet plot is reference simulated answer with the same components and the same crossover except one element in this example. Yellow plot is current simulated answer with reverse polarity. The black plots are original drivers responses. The gray plots are drivers responses with crossover's sections.
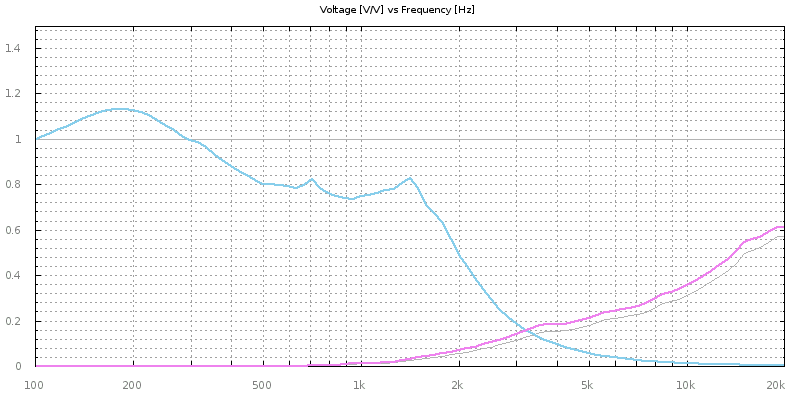
Below you can see simulated voltage answer at drivers example. The cyan plot is for low section. The magenta plot is for high section. The gray plots are for reference simulated answer. In this case there are only one gray plot for high section.
A order of colours you can remember by CMYK acronym. Low section is cyan. Next is magenta and if you work with 3-way simulator, the last is yellow or black.
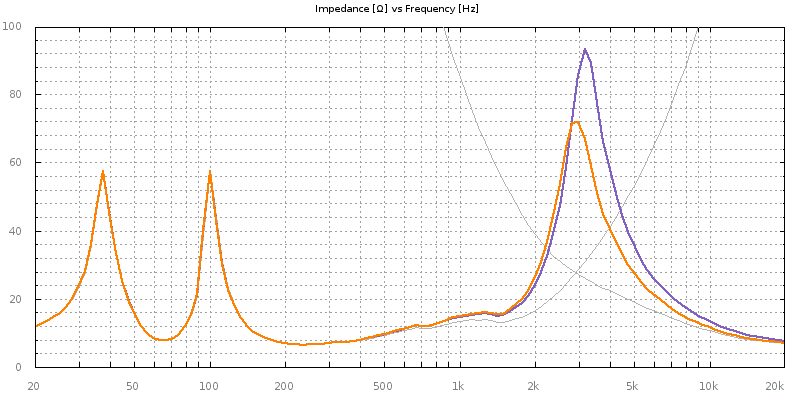
Below you can see simulated impedance answer example. The orange plot is current simulated answer and the violet plot is reference simulated answer. The gray plots are impedances of individual crossover's sections.
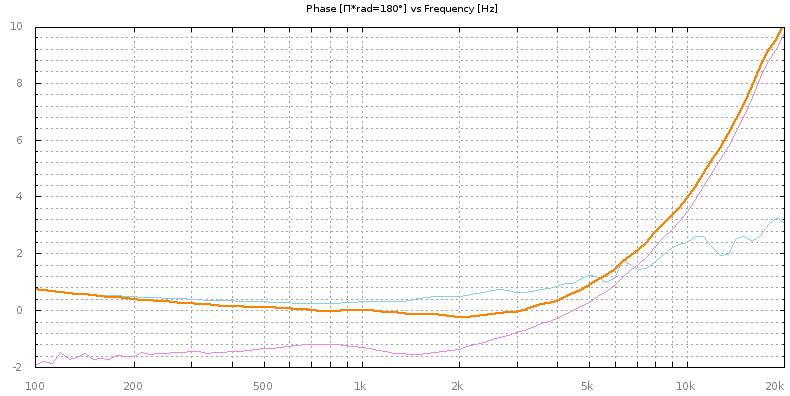
Next picture show phase plots. The orange plot shows SPL phase of current simulated loudspeaker. The cyan is original (without crossover) phase of low section driver. The magenta is original phase of next section driver. In 3-way case yellow or black is used for high section driver. A order of colours is the same like in voltage graphs ordered by CMYK acronym.
This picture shows not default view. By default individual drivers plots are for drivers with attached crossover's sections. You can change it to original phase of drivers via 'settings' button. You can also display all possible individual drivers plots. Then plots with the same colours are distinguished by dots for plots with attached crossover's sections.
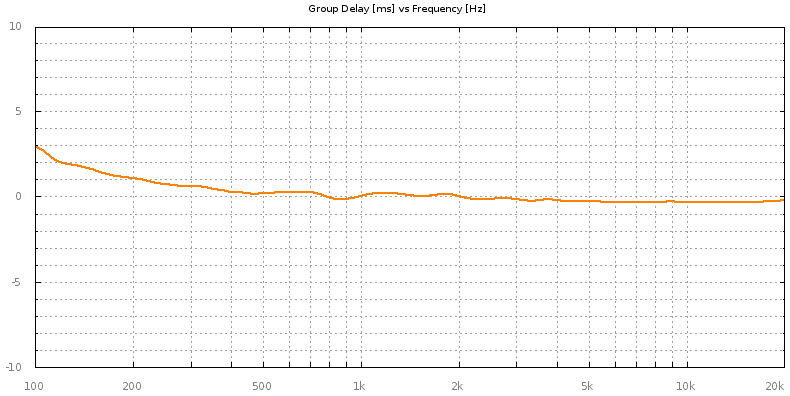
At the end you can see plot of group delay of simulated loudspeaker.
 Simulators
Practice
Simulators
Practice